Here are the preliminary results of the 70th annual Calgary Christmas Bird Count (CBC) which was held on December 19. Over 300 people participated this year – 136 field surveyors and 173 feeder watchers at 123 addresses. The current totals are 72 species (plus an additional two species seen during count week), and 75,917 individual birds.
(A previous version of this post had 326 field surveyors. That was an error, and the number has been corrected.)
These numbers are slightly higher than last year. The species total is higher than the long-term average of about 66. There are still some adjustments to be made to the numbers and the possibility of adding another species to the total.
For those interested in hearing all the details of this count, Matt Wallace will be speaking on the Nature Calgary Bird Study Group Zoom presentation on Wednesday January 12, along with the compilers of several of the other local CBC’s (and possibly even the Edmonton count!). Nature Calgary members should receive a link to this meeting by email. If you would like to become a Nature Calgary member, see this page.

Below is a more complete summary of the day, by Matt Wallace:
The 70th annual Calgary Christmas Bird Count took place on December 19. We had a highly successful year and I wanted to share the tentative numbers with you all.
Before jumping into the details I want to thank everyone who participated this year and acknowledge the outstanding efforts that were put in. The legacy and continuation of this count would not be possible without everyone’s contributions and appreciation for the natural world. Thank you to all of the participants and especially our section captains for accommodating the many new birders that joined in on the count. Thank you to TsuuT’ina Nation for allowing us the opportunity to visit your land on count day. I also want to give a special shout out to Lara Fitzpatrick and Bob Lefebvre for their superhuman coordination and data entry powers. They were both calm, cool, and enthusiastic about ensuring the collection of data and experience for participants was accessible and fun. Thank you to all!
Note: These are the tentative numbers (without adjustments) received on count day.
Weather:
A relatively mild day for Calgary in December compared to previous years with temperatures in the -20s. Light winds (~10-15 km/hr) began in the afternoon.
| Date | Max Temp. | Min Temp. |
| Dec 19 2021 | ‑10.1 °C | ‑13.4 °C |
Circle Sections and Participants
The Calgary Circle was divided into 38 sections this year. This is consistent with previous years as “subsections” were created for teams to survey within an official section of the circle. We now have an up-to-date digital map that includes all subsections. Participants were able to use the map in the field by saving it to their phone. This helped to ensure they were surveying within the circle boundaries and correct sections that they were assigned to. The Circle Section Map can be viewed here.
Participant numbers were strong with a total of 309 participants in total. There were a total of 123 Feeder Watcher residences with some households tag-teaming their yards throughout the day. On count day, a total of 136 people were in the field with many new birders joining the count for the first time. The number of field surveyors matches the average over the past 15 years (136). The field team hours were down from the record in 2020 (330) but we found more individual birds and more species than in 2020.
| Number of Participants | Total | Field Surveyors | Feeder Watchers |
| 309 | 136 | 173 | |
| Total Counting Hours | 615 | 273 | 342 |
| Field Surveyor Details | Total | Walking | Driving |
| Counting Hours | 273 | 203 | 69 |
| Distance Traveled (km) | 1498 | 461 | 1,036 |
Birds Summary
This year we used two methods to obtain bird data from field teams. Participants could share their eBird checklist with an account we created specific for the CBC. Effort data, mammal sightings, and bird data (not submitted to eBird) were submitted by each section captain using the template.
All eBird checklists (98) shared during count day can be viewed in the eBird Trip Report here.
| Count Results | Total | Count Week |
| Total Count – Species | 72 | 2 |
| Total Count – Individual Birds | 75,917 |
Below is the summary of all species and individuals counted. Field teams counted a total of 68,115 individuals (70 species) and Feeder Watchers counted 7802 individuals (35 species). Notable species and records are highlighted in yellow. Calgary count data has been collected since 1952.
(Use slider at bottom to reveal more columns.)
| SPECIES COUNTED | 2021 Count | 10-yr Average | 2021 vs. 10-yr Avg | % of Years Reported Since 2011 | % of Years Reported Since 1952 | Record High Count | Record High Year | Notes and Comments |
| Cackling Goose | 4 | 12 | -66% | 80% | 17% | 139 | 2004 | |
| Canada Goose | 23,967 | 12,902 | 86% | 100% | 74% | 27,452 | 2004 | |
| Trumpeter Swan | 5 | 1 | 456% | 30% | 12% | 5 | 2017/2021 | Tie for Record |
| Tundra Swan | 1 | 900% | 10% | 6% | 1 | 1991/2021 | Tie for Record | |
| Wood Duck | 3 | 3 | 7% | 80% | 42% | 40 | 2007 | |
| Gadwall | 1 | 1 | 0% | 50% | 41% | 29 | 1987 | |
| Mallard | 17,323 | 11,356 | 53% | 100% | 100% | 24,506 | 1992 | |
| Green-winged Teal | 1 | 150% | 20% | 54% | 9 | 1981 | ||
| Canvasback | 2 | 1 | 300% | 30% | 14% | 2 | 1963/2021 | Tie for Record |
| Redhead | 18 | 13 | 37% | 70% | 45% | 35 | 2020 | |
| Ring-necked Duck | 5 | 2 | 213% | 60% | 19% | 5 | 2019 | |
| Greater Scaup | 2 | 1 | 300% | 30% | 14% | 6 | 2007 | |
| Lesser Scaup | 5 | 3 | 79% | 80% | 58% | 14 | 1991 | |
| Harlequin Duck | 4 | 1 | 264% | 50% | 38% | 7 | 1989 | |
| Bufflehead | 144 | 194 | -26% | 100% | 72% | 321 | 2015 | |
| Common Goldeneye | 554 | 1,110 | -50% | 100% | 99% | 5,356 | 2007 | Low Count Year |
| Barrow’s Goldeneye | 3 | 10 | -69% | 100% | 72% | 25 | 2016 | |
| Hooded Merganser | 2 | 3 | -38% | 90% | 54% | 8 | 1995 | |
| Common Merganser | 86 | 80 | 7% | 100% | 99% | 159 | 2017 | |
| Ruddy Duck | 1 | 900% | 10% | 3% | 1 | 2018/ 2021 | Tie for Record | |
| Sharp-tailed Grouse | 3 | 900% | 10% | 39% | 25 | 1986 | Notable Sighting | |
| Gray Partridge | 58 | 66 | -13% | 100% | 97% | 276 | 1977 | |
| Ring-necked Pheasant | 11 | 10 | 12% | 100% | 99% | 124 | 1961 | |
| Rock Pigeon | 1,417 | 1,992 | -29% | 100% | 70% | 4,611 | 2006 | |
| Eurasian Collared-Dove | 2 | 26 | -92% | 80% | 13% | 63 | 2015 | Low Count Year |
| American Coot | 1 | 1 | -9% | 50% | 22% | 4 | 2018 | |
| Wilson’s Snipe | 1 | 233% | 10% | 17% | 3 | 2005 | Notable Sighting | |
| Sharp-shinned Hawk | 4 | 6 | -29% | 90% | 33% | 10 | 2014 | |
| Northern Goshawk | 6 | 4 | 46% | 90% | 74% | 9 | 2019 | |
| Bald Eagle | 69 | 33 | 110% | 100% | 80% | 69 | 2021 | Record Year |
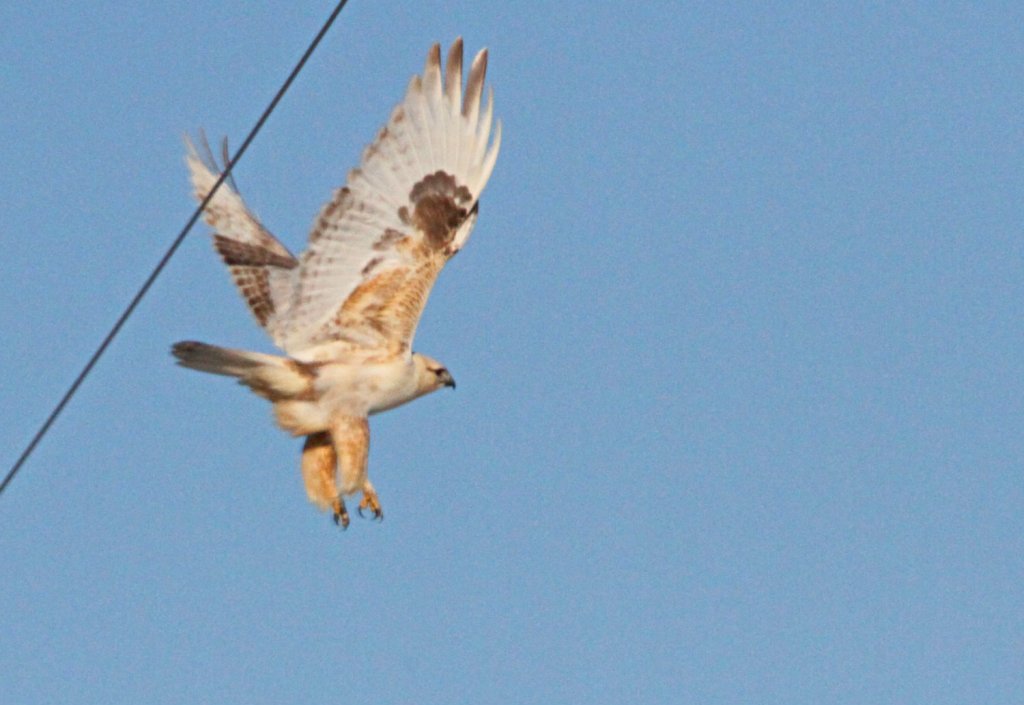
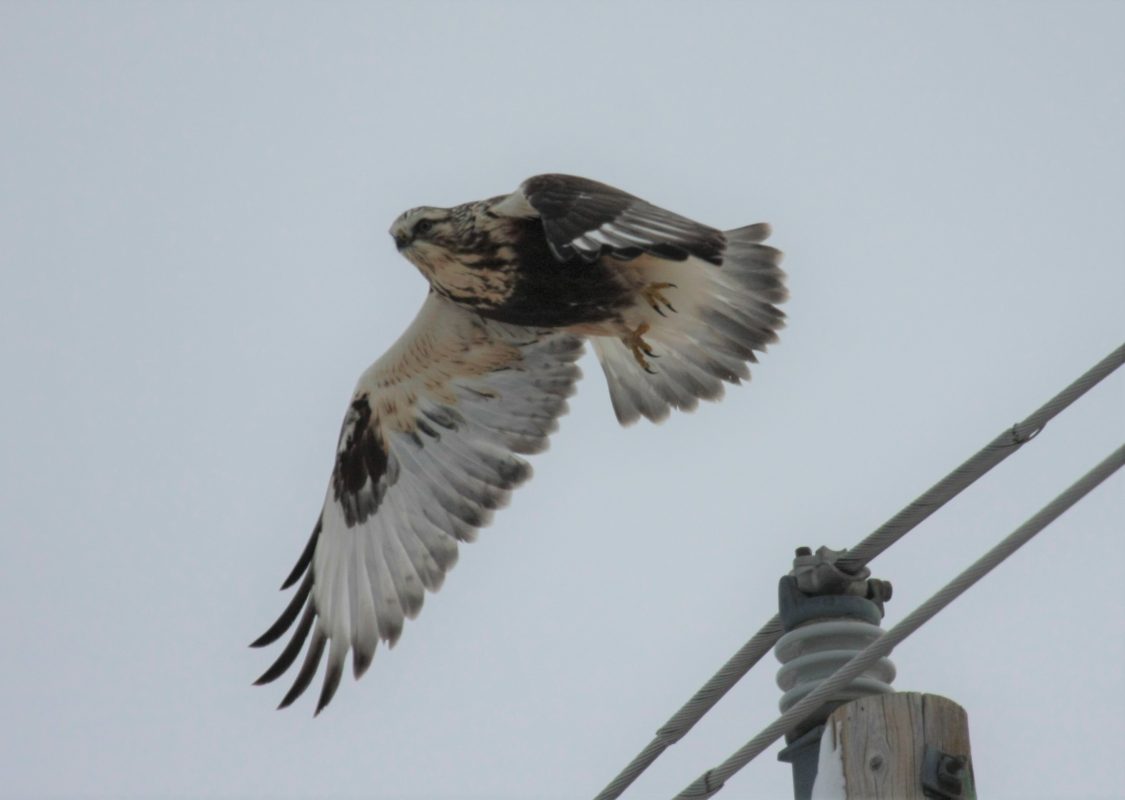
| Rough-legged Hawk | 5 | 7 | -30% | 100% | 71% | 17 | 2015 | |
| Great Horned Owl | 9 | 7 | 30% | 100% | 84% | 26 | 1991 | |
| Snowy Owl | 1 | – | – | 0% | 58% | 15 | 1973 | Notable Sighting |
| Northern Saw-whet Owl | 1 | 1 | 25% | 60% | 25% | 2 | 2005 | |
| Belted Kingfisher | 3 | 2 | 36% | 100% | 72% | 9 | 1988 | |
| American Three-toed Woodpecker | 2 | 1 | 82% | 50% | 39% | 5 | 1980 | |
| Downy Woodpecker | 263 | 181 | 46% | 100% | 96% | 263 | 2021 | Record Year |
| Hairy Woodpecker | 39 | 35 | 11% | 100% | 86% | 50 | 2018 | |
| Pileated Woodpecker | 4 | 2 | 100% | 90% | 49% | 5 | 2015 | |
| Northern Flicker | 363 | 229 | 59% | 100% | 78% | 363 | 2021 | Record Year |
| Merlin | 24 | 22 | 8% | 100% | 93% | 43 | 2015 | |
| Gyrfalcon | 1 | 1 | 43% | 40% | 30% | 4 | 1990 | |
| Northern Shrike | 8 | 5 | 57% | 100% | 78% | 11 | 2015 | |
| Blue Jay | 137 | 112 | 22% | 100% | 61% | 256 | 1994 | |
| Black-billed Magpie | 2,401 | 2,607 | -8% | 100% | 100% | 3,096 | 2020 | |
| American Crow | 65 | 103 | -37% | 100% | 72% | 152 | 2012 | Low Count Year |
| Common Raven | 625 | 507 | 23% | 100% | 70% | 858 | 2017 | |
| Black-capped Chickadee | 2,140 | 1,910 | 12% | 100% | 100% | 2,221 | 2006 | |
| Mountain Chickadee | 7 | 4 | 84% | 60% | 48% | 19 | 1987 | |
| Boreal Chickadee | 7 | 18 | -60% | 100% | 81% | 101 | 1987 | |
| Golden-crowned Kinglet | 2 | 18 | -89% | 100% | 86% | 85 | 1990 | Low Count Year |
| Red-breasted Nuthatch | 200 | 382 | -48% | 100% | 75% | 727 | 2015 | |
| White-breasted Nuthatch | 110 | 108 | 2% | 100% | 81% | 203 | 2014 | |
| Brown Creeper | 17 | 20 | -16% | 100% | 84% | 33 | 2014 | |
| American Dipper | 3 | 2 | 36% | 90% | 61% | 7 | 1994 | |
| European Starling | 326 | 320 | 2% | 100% | 99% | 1,445 | 1995 | |
| Townsend’s Solitaire | 18 | 4 | 350% | 100% | 48% | 18 | 2021 | Record Year |
| American Robin | 82 | 86 | -5% | 100% | 62% | 219 | 2001 | |
| Bohemian Waxwing | 15,816 | 10,262 | 54% | 100% | 96% | 20,012 | 2005 | |
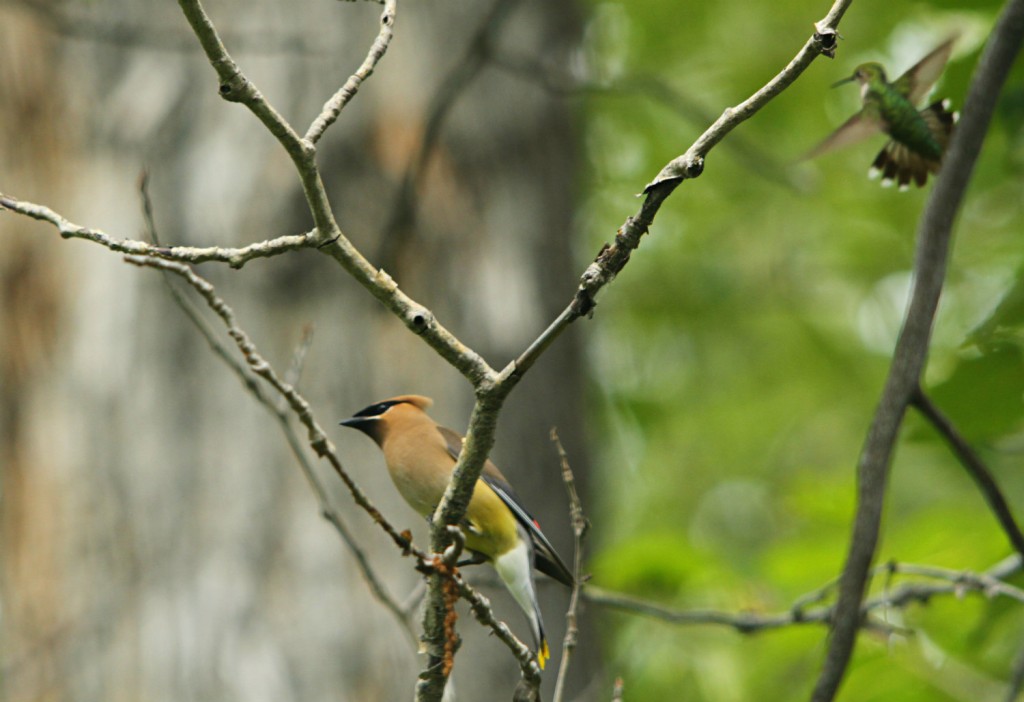
| Cedar Waxwing | 11 | 12 | -4% | 70% | 45% | 88 | 2003 | |
| House Sparrow | 7,096 | 6,113 | 16% | 100% | 97% | 10,304 | 2000 | |
| Pine Grosbeak | 64 | 196 | -67% | 90% | 87% | 862 | 2011 | |
| House Finch | 1,916 | 1,046 | 83% | 100% | 45% | 1,916 | 2021 | Record Year |
| Common Redpoll | 272 | 580 | -53% | 100% | 93% | 2,025 | 1995 | |
| Hoary Redpoll | 2 | 3 | -20% | 30% | 39% | 22 | 1969 | |
| White-winged Crossbill | 40 | 718 | -94% | 90% | 59% | 4,448 | 2015 | Low Count Year |
| Pine Siskin | 50 | 187 | -73% | 100% | 62% | 772 | 2003 | |
| American Tree Sparrow | 3 | 2 | 100% | 50% | 45% | 34 | 1999 | |
| Dark-eyed Junco | 64 | 163 | -61% | 100% | 71% | 392 | 2018 | |
| White-crowned Sparrow | 1 | – | – | 0% | 3% | 1 | 2005 | |
| White-throated Sparrow | 9 | 3 | 233% | 70% | 35% | 15 | 1994 | |
| Song Sparrow | 2 | 1 | 300% | 40% | 26% | 3 | 1995 |
Count Week Species: Varied Thrush, Prairie Falcon
Species Normally seen but not counted in 2021: Northern Pintail, Ruffed Grouse, Cooper’s Hawk, Red Crossbill
Just a reminder that these numbers are tentative. I will be presenting a more in-depth analysis on the count and describe our methods for adjusting these initial numbers at the Nature Calgary Bird Study Group on January 12 via Zoom.
Thank you all. Merry Christmas and all the best in the New Year!
Matt Wallace
