Rob English photographed this leucistic Mallard in Beaverdam Flats in mid-February. This might be the same duck seen in the same area last winter.
Tag Archive | birds calgary blog
Q & A: Follow-up on Attracting Birds to Feeders
Last May we answered a question from a reader who had been trying unsuccessfully to attract birds to her yard in Calgary. The yard was in an awkward location at a small townhouse without trees or shrubs. Although she was putting out many types of high-quality seeds, the birds were not coming. We gave some advice on attracting birds, which you can read about here. We are happy to report that after nearly a year of persistent effort, finally there are birds coming to the yard.
———-
Hi,
Sunday Showcase: Great Grays of Grand Valley Road
Furry Friday: Porcupine
Sunday Showcase: Bald Eagle Fledgling
Sunday Showcase: Snow Bunting
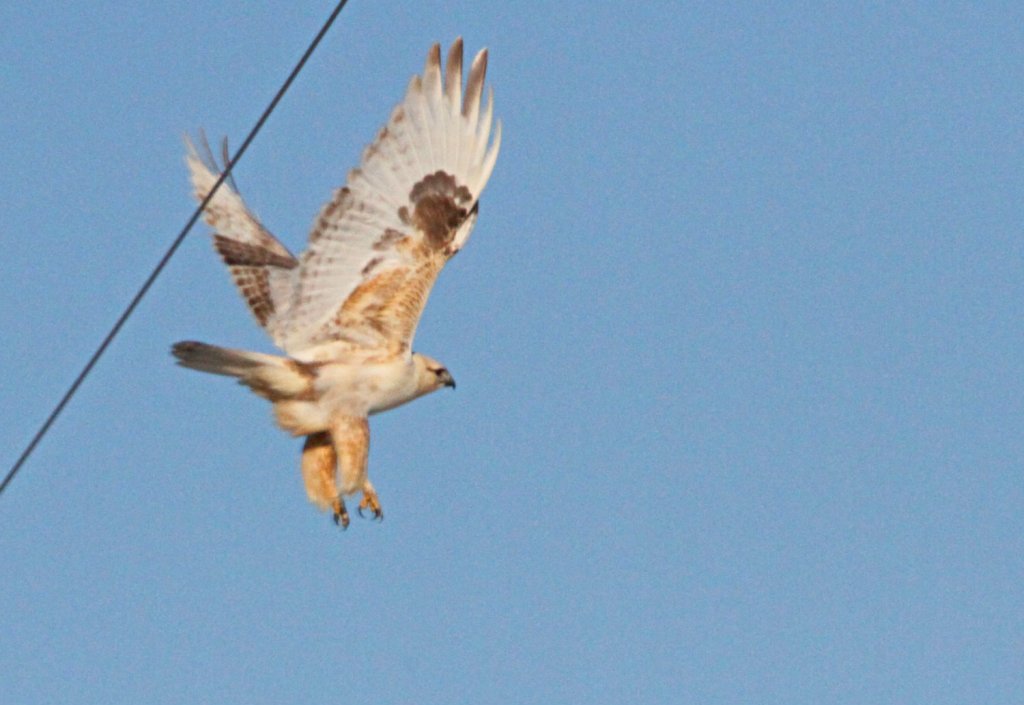
Leucistic Rough-legged Hawk
Posted by Matthew Sim
We’ve done posts here on this blog about leucism before, which is when a bird has reduced pigmentation, meaning it has more white in it’s feathers than normal for the species. We’ve had some examples before, including a leucistic House Finch, American Robin, Ruby-throated Hummingbird and others. For the past few months, Calgary has had a very neat leucistic bird in the area. This Rough-legged Hawk frequents the area around Highway 40, just west of Calgary.

Now compare this with a more normal Rough-legged Hawk.
On January 1rst, I found this leucistic hawk on Highway 40 near its intersection with Range Road 40.
Furry Friday: Mink
Wednesday Wings: More Snowies!
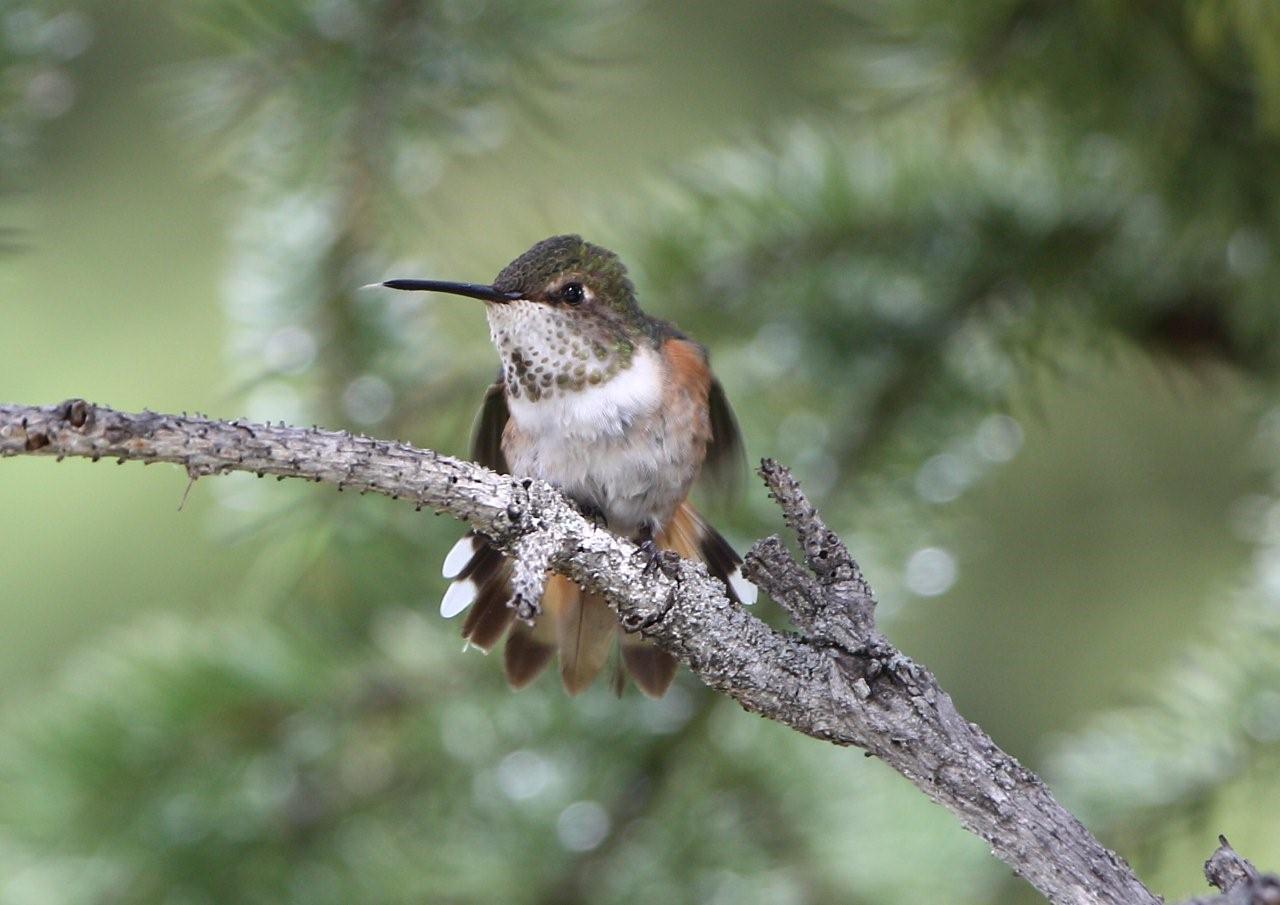
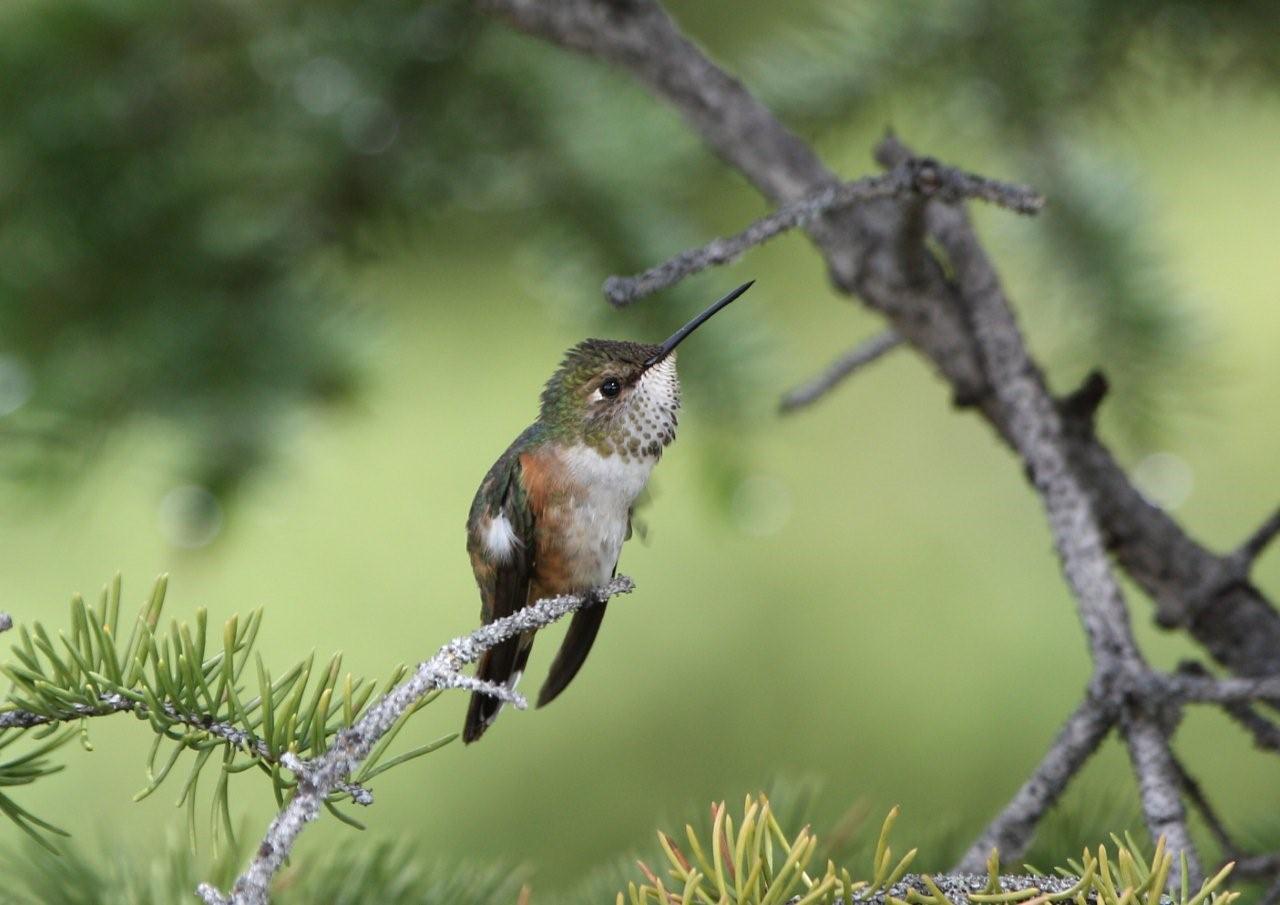
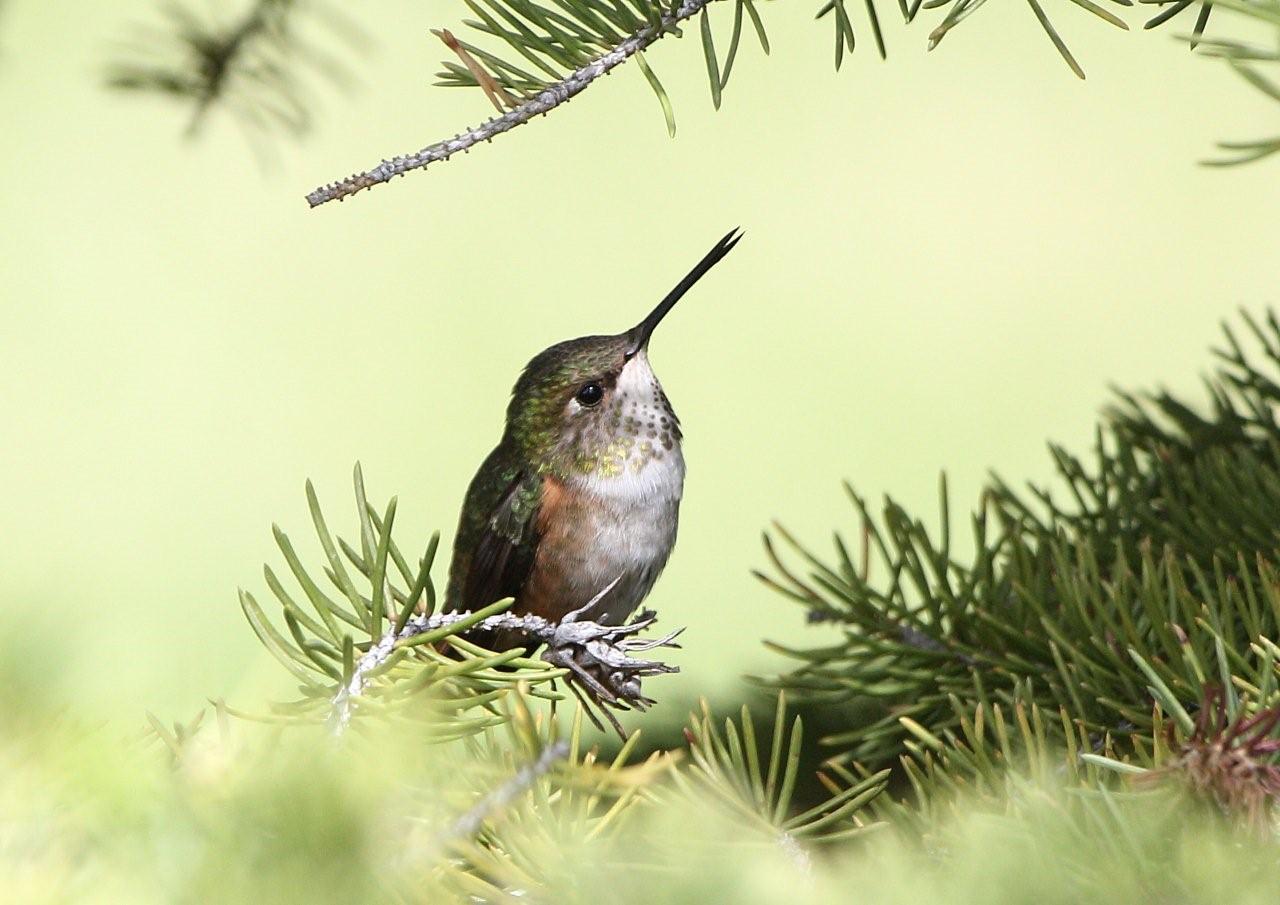
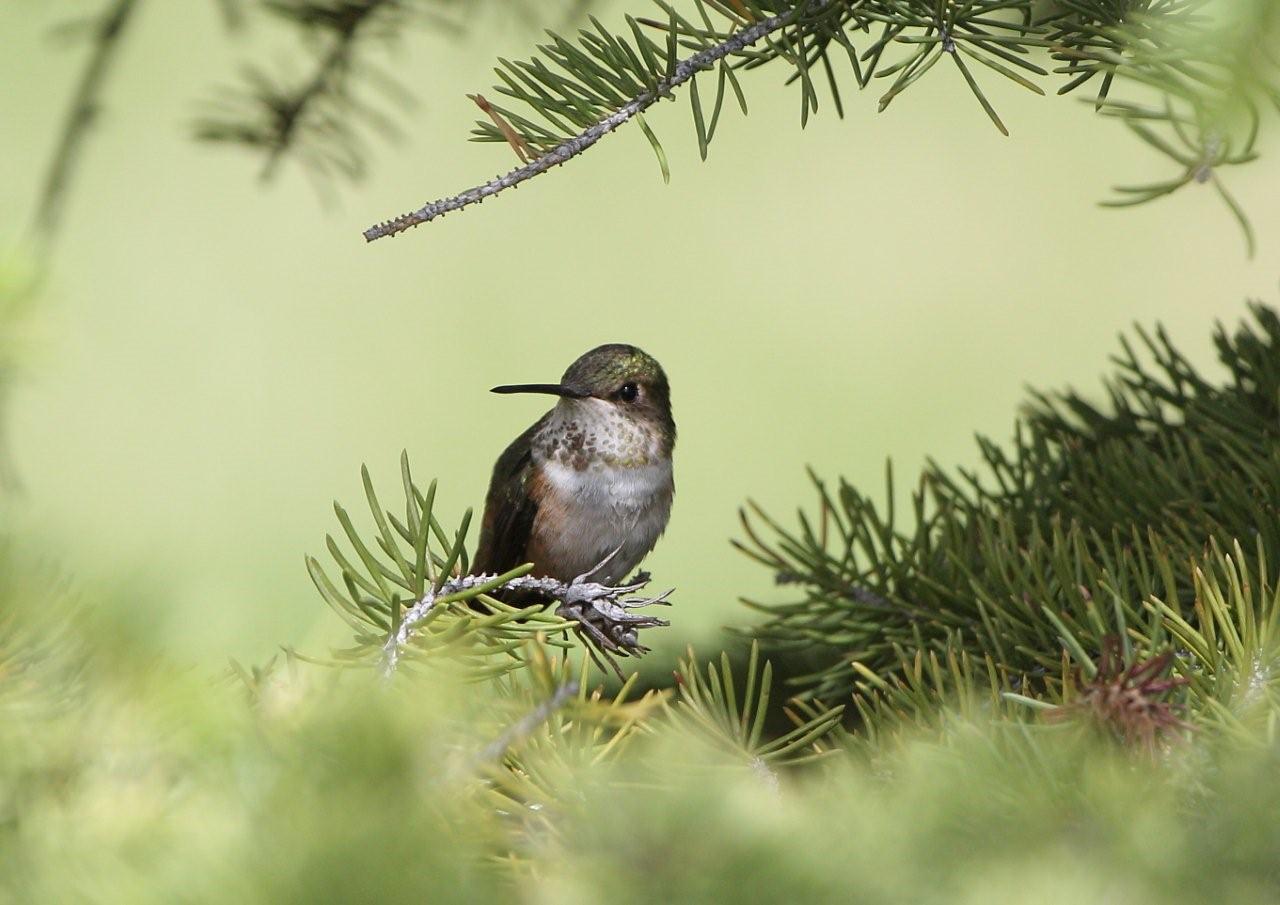
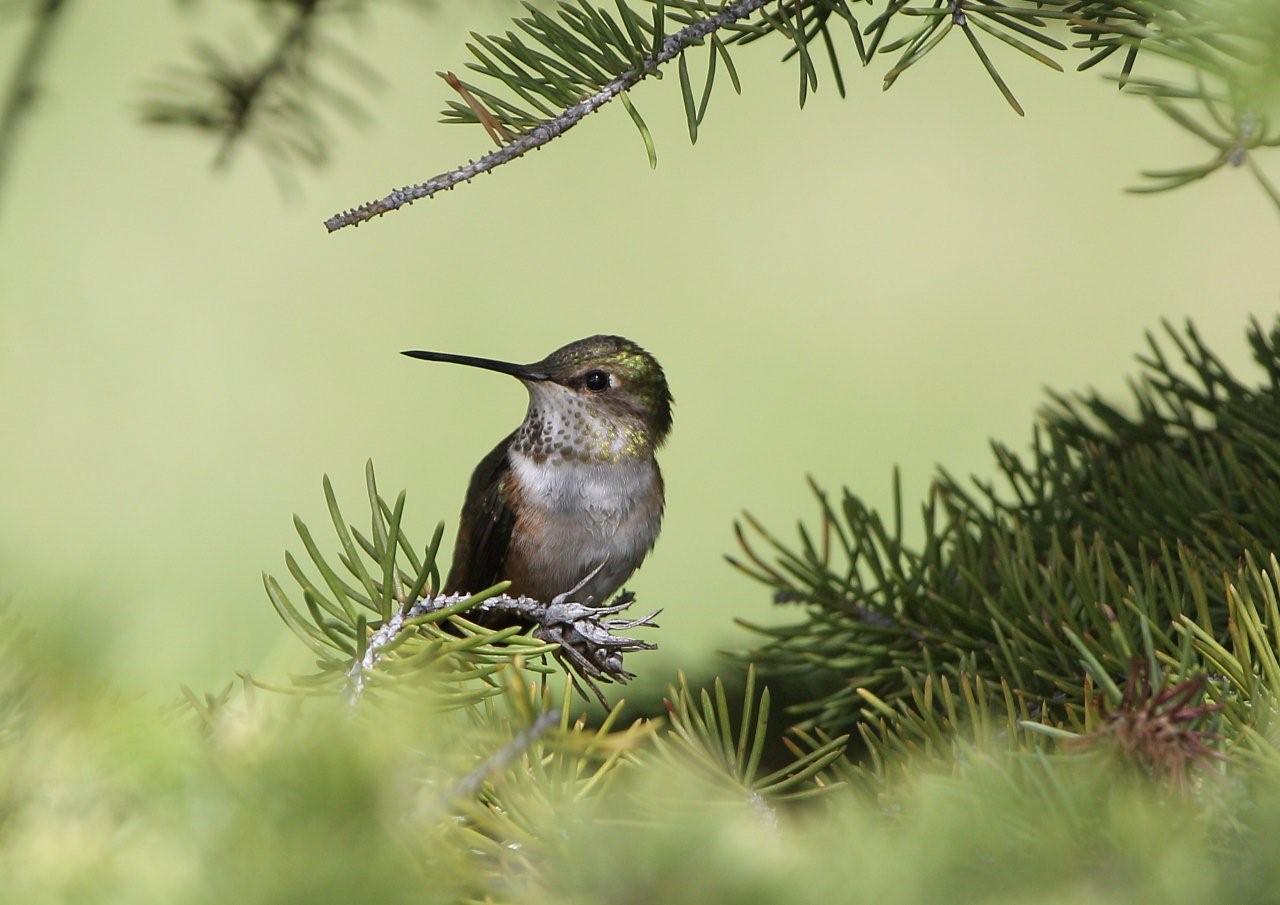
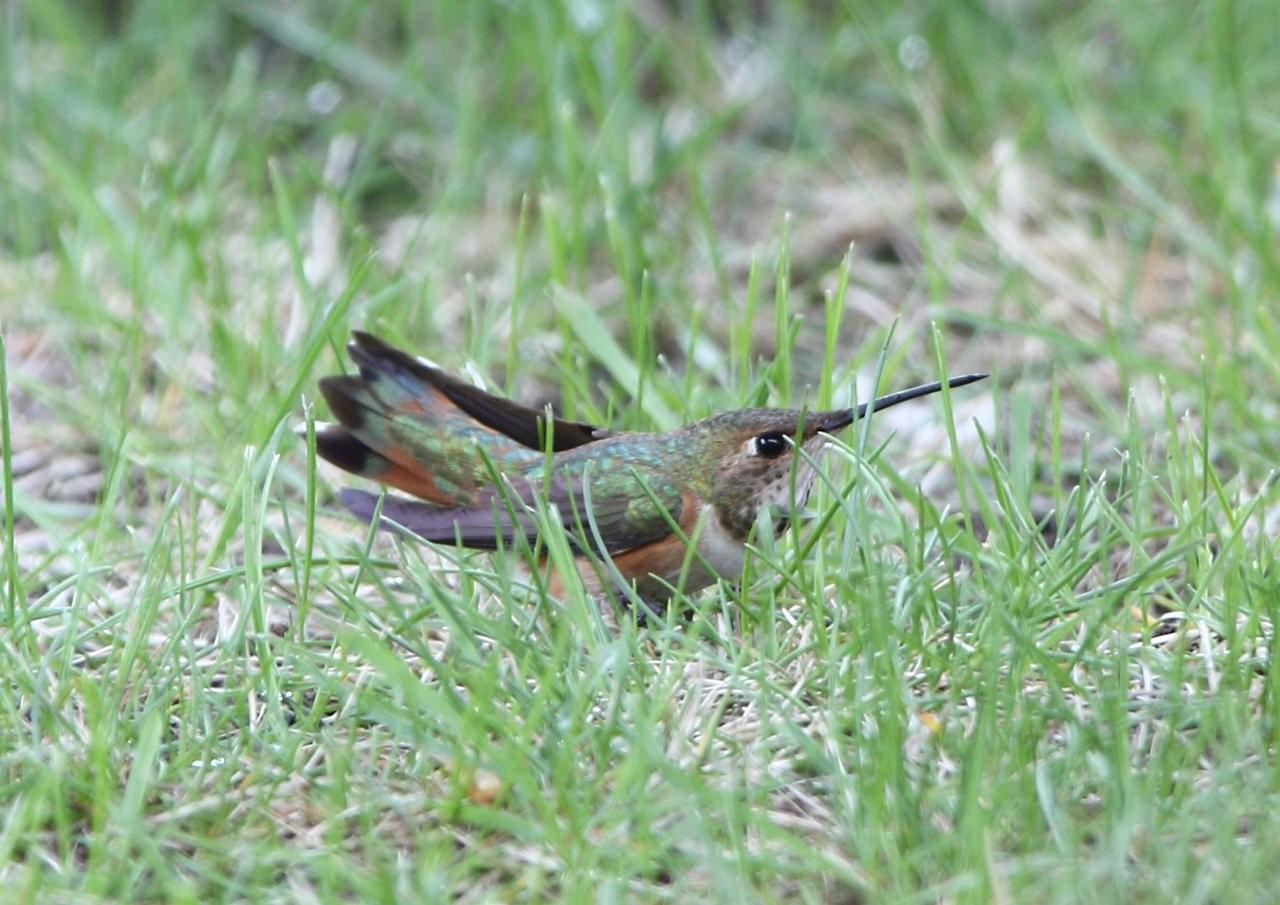
Sunday Showcase: Female Rufous Hummingbird
Photos taken by Rob English near Highwood House, SW of Calgary, in June 2012.
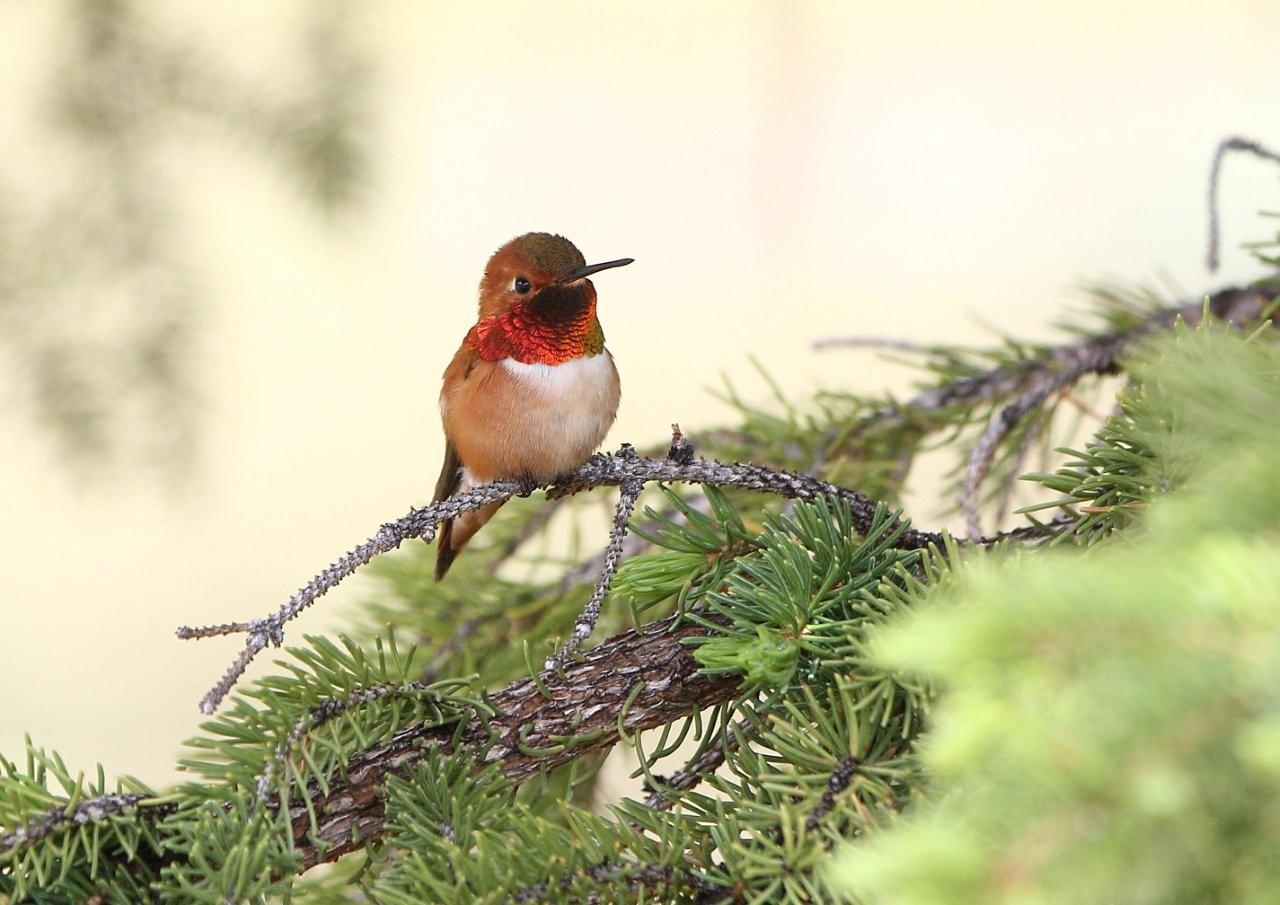
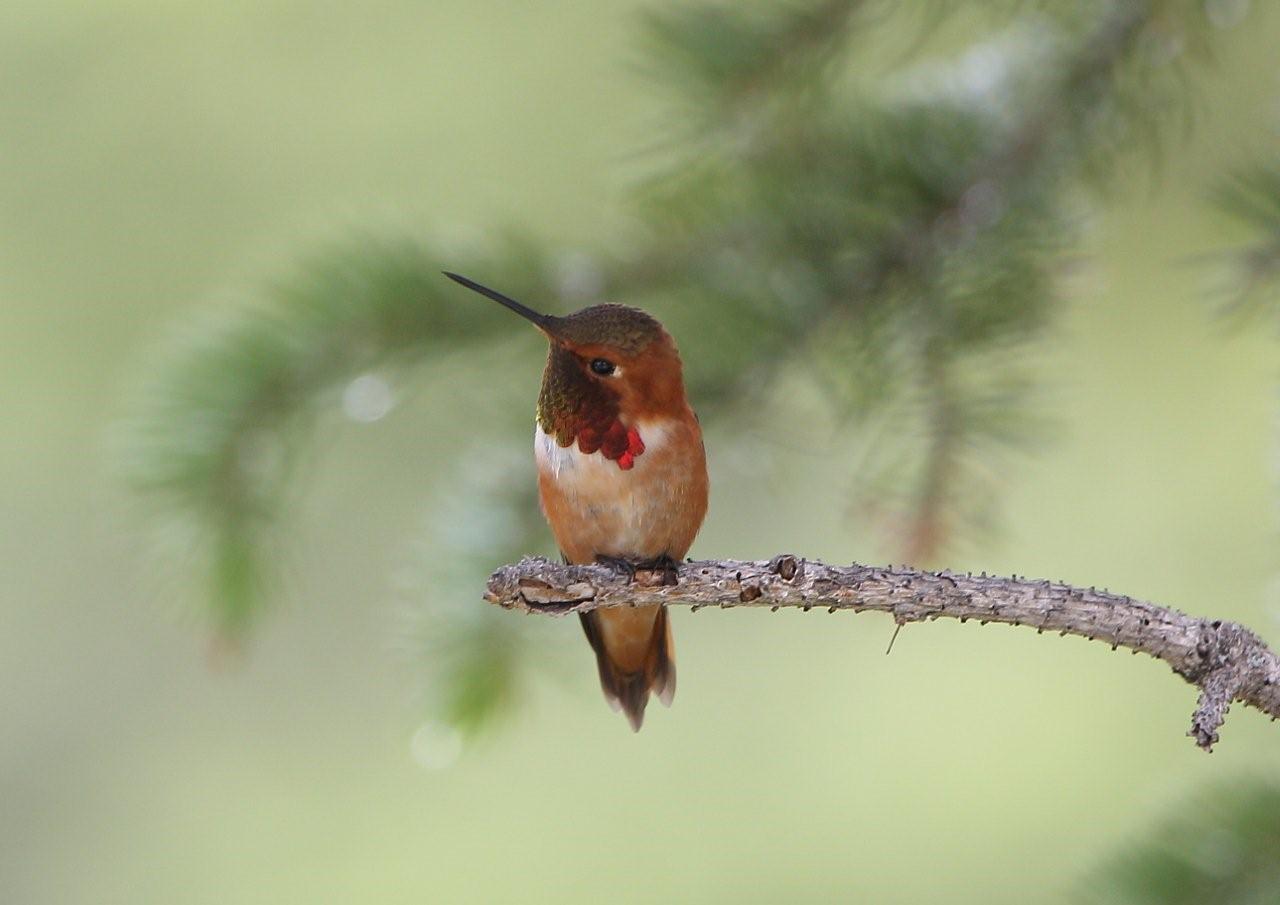
Here are a couple of shots of a male Rufous Hummingbird taken at the same time, to show the difference. For more of Rob’s photos of a male Rufous, see this post.


